


Sooner or later, it had to happen… and so it did: in the world of digital marketing, June 30, 2023 has officially gone down in history as the last day of life for Google Universal Analytics, the faithful companion of so many digital marketers since its launch on April 2, 2014.
Although some data still continues to be processed, Universal Analytics has retired.
In this article, we will try to list the main differences between Google Analytics 4 and its predecessor, trying to understand why (or in what) GA4 is improved over Universal.
As a very brief historical reference, Google Analytics was developed by Urchin Software Corporation, later acquired by Google in April 2005.
Universal Analytics (UA), on the other hand, was launched on April 2, 2014, and represented the third version of the analytics software.
Although Google Analytics 4 (or GA4) was the default option for new Google Analytics properties as early as October 14, 2020, many continued to work with the old version of the tool. Now that GA4 has become mandatory, however, the impact with this change has been quite significant, generating some panic in the industry and triggering a rush to learn the new platform.
Assuming that Google Analytics 4 works very differently from its predecessor, here are the main differences between GA4 and Universal Analytics:
-
- Data Model structure
- App tracking
- Different calculation of Sessions
- Average session duration
- Bounce rate and engagement rate
- The importance of Google Tag Manager
- Predictive metrics
- Looker Studio and GA4
- Data retention
- IP address anonymization
- Account structure
Let’s take a detailed look at each.

1. Structure of the Data Model
A key difference between Universal Analytics and GA4 lies in how interactions are captured, hence in the structure of the Data Model.
In UA, in fact, interactions were captured in different types of ‘hits’, such as page views, transactions, and social interactions.
In GA4, in contrast, each interaction is captured as an ‘event’ (which in turn may contain related parameters).
These event parameters are additional information about the action (event) that a user has taken. Some event parameters are sent automatically from the site to GA4, such as the page_title.The special feature of GA4, hence the difference with UA, lies in the possibility of being able to add up to 25 parameters for each event, making each event and, consequently, each analysis, completely customizable.
UAs Data Model, in fact, was based on sessions, defined as groups of interactions that users make within the website over a given period of time (a data model called session centric).
Within a session, then UA tracked and measured how users interacted with a website and what actions they performed within it (e.g., purchases, page views, etc.).
However, in order to know exactly what actions users took on the website during a session it was necessary to implement additional tracking events (e.g., clicks on a video, page scrolls, etc.).
In contrast, in GA4 any interaction that a user performs can be captured in the form of an event.
In other words, GA4’s event centric Data Model allows you to collect more information about the actual behavior of visitors to a site (e.g., the title of the page visited, the value of any purchase, etc.).
This is because in GA4 you not only have more tracking events that you can implement, but also more parameters that you can use.
That is why one of the great advantages of GA4’s Data Model is precisely that you can customize the tracking events you want to implement based on the goals of the business in question.
2. App Tracking
Another of the most anticipated features of GA4 was the ability to track data from websites and apps on the same property.
This is possible because GA4 leverages the same measurement model as Google Analytics Firebase (used for apps) in which all interactions are captured as events.
This new unified data scheme (between a website and a mobile app) makes it easier to combine, process, and analyze data with each other.
A user, therefore, can start an app and be considered active in GA4 (this was not possible with Universal Analytics).

3. Different Calculation of Sessions
Another clear difference between UA and GA4 that is apparent concerns the different way sessions are counted.
In UA, in fact, a session represented the period of time a user was actively engaged with the site.
In GA4, on the other hand, the session_start event generates a session ID to which all subsequent events during the session are associated.
For example, if a user passes midnight, a new session would start in UA, while in GA4 the session would continue normally, hence leading to a different session count.
In UA, a session can include multiple page views, events, social interactions, and e-commerce transactions. Typically, sessions are defined as “ended” after a 30-minute period of inactivity or if another event has occurred.
GA4’s session metrics are derived from the session_start event (automatically collected by Google as soon as a user interacts with the site or app), and the duration of a session is based on the time interval between the first and last event tracked in the session.
In practice, when a session starts Google automatically collects a session_start event and generates a session ID (ga_session_id) and a session number (ga_session_number) via the session_start event.
The session ID identifies the session from which an event originates. For example, two different session IDs are generated when a user has two separate sessions on the site.
The session number identifies the number of sessions a user has started up to the current one (e.g., the third or fifth session on the site).
GA4 then calculates the number of sessions occurring on the site or in the app by estimating the number of unique session IDs.
4. Average Session Duration
On UA, if a user lands on the first page and after 120 seconds moves to the second page and then closes the browser without any other interactions being sent to Google beyond the two pageviews (even if he stays there for 20 minutes), the average time on the page will result in 120 seconds, i.e., 120 / (2 – 1).
The (2 – 1) represents the total number of pageviews (2) minus the number of outgoing pages (1). Obviously, this is an example based on one session, and the number of ‘outgoing pages’ will always be 1; on a larger scale, that is, on a significant number of sessions by users who may have viewed 2, 3, 5 or more pages per session, the ‘outgoing pages’ outcome will evidently be different.
If, on the other hand, the user, in a session, visits only one page before exiting (this to be considered a ‘bounce session’), regardless of how much time he or she spent on this page before closing the browser, for Google Analytics, the time value will result for Google Analytics as 0 seconds.
You have a session of 0 seconds duration that does not affect the total session duration, but instead affects the number of sessions found in the denominator of the average session duration formula.
Trying to simplify:
-
- Average time on page is represented by: time spent on pages / the number of pages visited that are not exit pages;
- Average session time is represented by: time spent on pages / the total number of sessions (including those considered bounce sessions).
On GA4, user engagement corresponds to the time a user spends on your active web page or featured app screen. This metric allows you to measure when users are active on your site or in your app.
When a user starts a new session, GA4 starts recording the duration of the session (we show you below an example from Google Support).
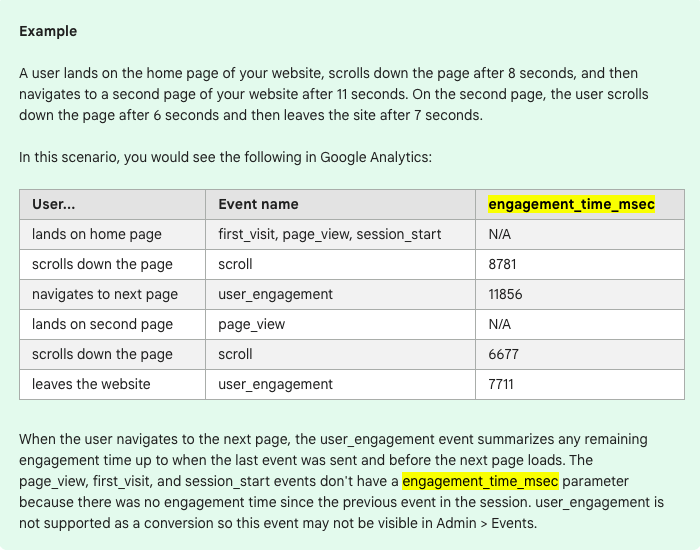
Google uses this information to complete engagement metrics such as User Engagement and Average Duration of Engagement.
The latter is the average time during which your website was viewed in the browser or your app remained in the foreground of the user’s device.
Average engagement duration is calculated this way: total durations of user engagement / number of active users.
5. Bounce Rate and Engagement rate
Some of the shortcomings that have been most noticeable to everyone with GA4 concern the metrics related to bounce rate. In its place, in fact, Google has introduced the new engagement rate metric.
Simply put, it is a ratio metric presented as a percentage and the formula is [sessions]/[sessions with engagement].
‘Sessions with engagement’, to be defined as such, must have a duration of at least 10 seconds, generate at least 1 conversion event or generate 2 different pages.
If you think about it for a moment, then, the bounce rate has only changed the way it exists: in GA4, in fact, it can very well be represented as the percentage of unengaged sessions.
Consequently, the bounce rate is nothing more than the opposite of the engagement rate, while on UA, the bounce rate was calculated as the percentage of website users who did not see more than 1 page on your website.
Example
Suppose a user visits your website, reads some content for less than 10 seconds, and then leaves the site. Also, during this session, he/she does not activate any events or visit any other pages.
In this case, because the user does not match any of the criteria for an engaged session (the session lasted less than 10 seconds, no conversion events occurred, and there were not at least two page or screen views), the session will not be counted as an engaged session.
If this was the only session on your website, the engagement rate will be 0% and the bounce rate will be 100%.
Conversely, if a user visits your website and stays there for more than 10 seconds, visits a second page, or triggers a conversion event, this session will be counted as a “session with engagement“ (the percentage figure for which is provided to us by GA4).
In summary, the engagement rate measures the percentage of visits with some form of meaningful engagement and which, therefore, represents definitely better-quality traffic.

6. The Importance of Google Tag Manager
While the basic functionality of UA was possible even without its support, with GA4 it is no longer possible to do without the Google Tag Manager (GTM).
Precisely because all goals are event-based, as we have seen, knowing how to work with GTM (especially for advanced data collection and the creation of custom events and dimensions) is critical.
7. Predictive Metrics
Google Analytics automatically enriches your data by leveraging Google’s machine learning expertise on your data set to predict your users’ future behavior. With predictive metrics, you can gain additional insights about your customers simply by collecting structured event data.
This is currently a feature being released for purchase-events only.
8. Looker Studio and GA4
Looker Studio (an online tool for converting data into customizable reports and information dashboards, formerly called Google Data Studio) is easily integrated with GA4 via Google’s “Google Analytics” connector.
GA4 data visualization with Looker Studio allows for more flexible data visualization than can be done through the GA4 interface itself, with a greater variety of ready-made charts and templates that can be used.
9. Data Retention
Whereas UA used to retain data forever (by the way, remember to download the history before it is deleted), GA4’s data expires after 14 months.
To remedy this, therefore, you will either need to set up a backup copy of GA4 data on BigQuery or save yourself a copy of everything.

10. IP address Anonymization.
Under the GDPR, IP address is considered personal data. While ad hoc configuration was required in UA, in GA4 IP addresses are automatically anonymized.
11. Account Structure
In UA, the structure of an account contained 3 elements: Account, Properties, View.
GA4, however, has been simplified and contains only two elements: Account and Properties.
In addition, Google introduced a completely new concept in GA4: data streams. A data stream represents a flow of data from your website or app to Analytics.
Whereas UA collects data at the property level with a tracking ID, GA4 collects data at the flow level through a single ‘data flow’ ID. Each GA4 property can have up to 50 data streams and a limit of 30 data streams from mobile apps.
In addition to the structural differences we have just listed, which are strong indicators to the diversity between UA and GA4, there is also a significant difference in user-experience, due to the different interfaces developed which users will need to work with.
The functions related to configuration, report development and use, along with the integration with other services, have been profoundly modified: this has resulted in a completely different user interface and the need to familiarize oneself with a completely new environment and workflow.

Conclusion
GA4 ultimately has the ambition to provide a more comprehensive view of user behavior on both websites and apps, thanks in part to the use of technology based on a machine-learing. GA4 has also applied data protection logic, which is necessary given evolving privacy regulations.
In addition to this, in itself a nice step forward compared to UA, greater flexibility in data configuration and improved report customization capabilities are certainly other positive aspects for Google’s new tool.
To recap, then, the revolution introduced by GA4 mainly allows us to:
-
- Collect and aggregate data from a website and an app (or apps) to better understand the user journey;
- Use event-based data instead of session-based data;
- Include privacy controls such as cookie-free measurement and behavioral and conversion modeling;
- Offer insights into user behavior through predictive features.
Let us remember, however, that GA4 is only at the beginning of its history, so let us be ready for the future evolutions and deployments that it will soon make available to us.
Main sources consulted:
-
- https://support.google.com/analytics/answer/11986666?hl=it
- https://support.google.com/analytics/answer/9964640?sjid=6476848819837359807-EU
- https://support.google.com/analytics/answer/10089681?hl=it
- https://support.google.com/analytics/answer/9234069?sjid=17125908057969018074-EU
- https://support.google.com/analytics/answer/9191807?sjid=17125908057969018074-EU&visit_id=638267285221466746-519494940&rd=1
- https://support.google.com/analytics/answer/11109416?hl=it
- https://support.google.com/analytics/answer/12195621?hl=it
- https://support.google.com/looker-studio/answer/6370352?hl=IT
- https://lookerstudio.google.com/gallery


Leave a Reply