

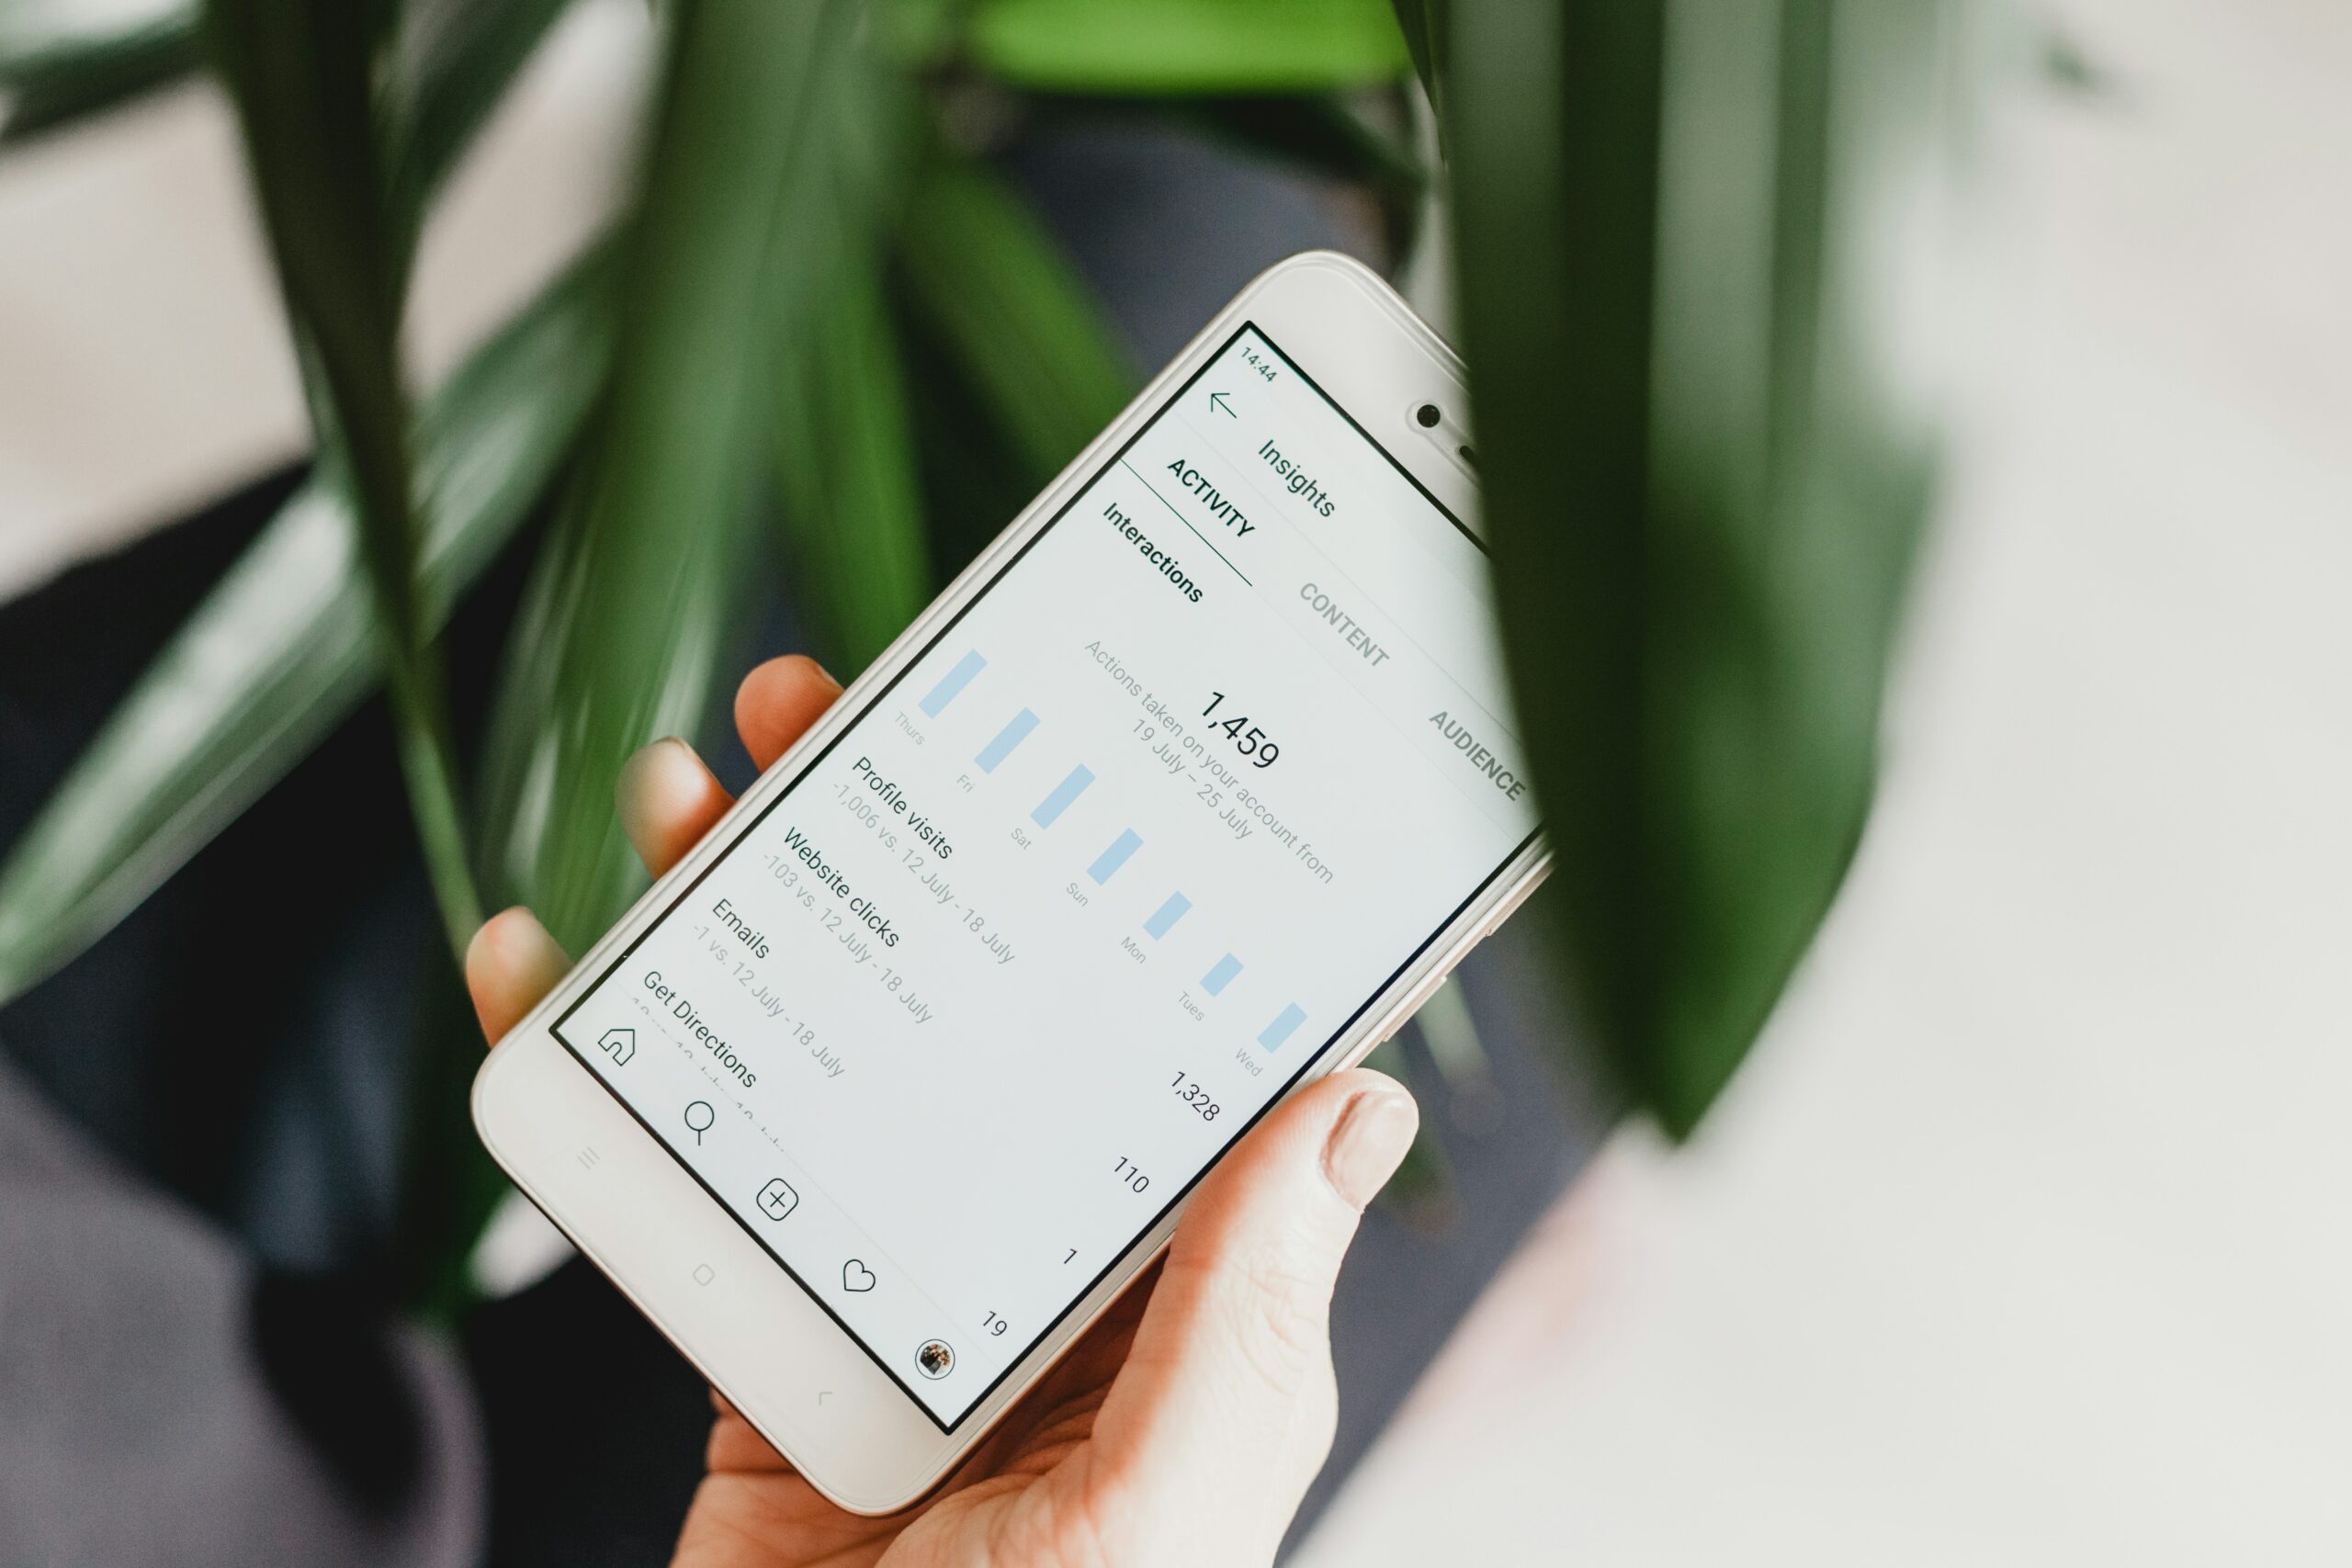
Key Performance Indicators, also shortened to KPIs, are the main indicators that allow us to measure the performance of a particular activity. Normally used in company organizations, KPIs quickly caught on in more technical and operational areas, thanks to their ability to focus on the performance of a specific, measurable activity and to structure a solid method for decision-making processes, through the constant consideration and application of possible improvements.
Precisely because of these characteristics, they have also proved very useful in the Social Media field, where they make it possible to assess the actual state of social activities and follow their improvement – or worsening – over time, consequently allowing broader strategic decisions to be made depending on the performance of the activities themselves.
Today, we’re talking about Instagram: which KPIs should we choose to ensure that the monitoring of our activity is as clear and optimized as possible? Let’s find out in this very article 👇🏼
CONTENT KPIs
It is good to remember right away that each social platform works in its own way and will therefore have its own specific indicators, but there are also indicators that may apply to multiple channels, as they identify objectively valuable parameters or, in other cases, simply because the functioning of the platform is similar in some mechanics.
Let’s start with an overview of the simplest indicators (they may seem trivial, but it never hurts to remember them):
- Number of content published (whether posts, stories, videos, reels and whatever)
- Likes
- Comments
- Shares
- Saves
- Click on link
- Click on link on the stories
- Stories views
PROFILE KPIs
The indicators just listed above will allow you to have a general overview of the specific post section, but it’s also essential to have one on the profile’s trends. So, for this kind of overview, we can analyze:
- Profile impressions
- Profile coverage (or reach)
- Followers
- Profile visits
- Website visits
Profile Activity
The last two data points listed above will also be very useful for extracting percentage indicators called conversion rate and click-through rate (also called CTR), which will help you understand how users behave once they arrive on your profile:
- Conversion Rate (%) – calculated using the formula “follower acquired / profile visits”, gives you an approximate idea of how many of the new users who arrived on your profile then became your followers.
- Click-through rate (%) – using the formula “website visits / profile visits” you can also find out the percentage of users who arrived on your profile and then clicked on your link in the bio.
These indicators are useful when we want to understand whether the CTAs on our profile and/or our content are correct and clear to users: did the users who arrived on my profile find it interesting enough to follow? Was the CTA in the link in the bio clear? Did I write it in such a way that the user was invited to take the action and actually click on the link? Or did the invitation to follow me or to click on the link in the bio that I included in my copy work? If you have asked yourself at least one of these questions, then it may be worthwhile to start tracking these indicators.
ADDITIONAL KPIs
Besides the KPIs we’ve just seen, which can be found in the platform insights, we want to tell you about a couple of indicators that we monitor within our reports and which will require some extra calculation, but which will be invaluable in evaluating the performance of your channel.
Followers
Of course, it is important to know the number of total followers, but have you ever wondered how the community evolved during the analyzed time period? Also, as we unfortunately know, Instagram doesn’t detail for you the followers variations in the time window you are interested in, but instead it will always give you the number of followers at the time you’re looking at the insights, even if you select a different time period. It may be impossible to get the exact data, but there is a way to bypass this problem; in addition to total followers, to your report you could add:
- Followers gained
- Followers lost
- Net followers – in the “followers gained – followers lost” formula
- The followers growth rate (%) – in the formula “net followers / total followers of the previous period” – to get a picture of the growth of your fan base period on period
You will then be able to include the total followers data in your report in the formula “total followers in the previous period + net followers in the current period”; in this way, you will obtain a figure that is certainly closer to reality than the one the platform provides.
Engagement Rate
Everyone talks about it, but not everyone fully understands it. The engagement rate is one of the most important indicators in the Social Media field because it allows us to measure how interested our community is about our content (assuming of course that a person’s interest can be traced back to the few simple actions monitored by the platform ☺) – it essentially measures how well we are doing our job and suggests whether we should revise our strategy because we are taking a different path from the one our followers are on.
Although there is a widespread set of methods to calculate it, it’s possible to distinguish two different types of engagement rates:
- Engagement Rate (%) – to obtain this figure we use the most popular calculation method we were talking about, hence the “sum of posts interactions in the period / total followers”. However, this type of ER has a flaw: essentially the engagement rate tells us the percentage of users who interacted with the content after seeing it, so it’s a bit unrealistic to use total followers as the denominator of the formula, since we know how unrealistic it is to reach all our followers base with our content. We know that it is not possible for all of our fan base to see our published content and, that such a small part of it has decided to interact with it; it is more realistic to think that only a part of the fan base has seen the content and that an even smaller part of it has interacted with it. ⚠️ So be careful when interpreting this data, both for you and for your clients! ⚠️
- Reach Engagement Rate (%) – in this case, we choose to divide the sum of interactions by the post reach, so we will be sure to get a more accurate ER, based only on the users actually reached by the content. Would we want to report a Reach ER that refers to a time period longer than that of a single post, we have two choices: we can either divide the sum of total posts’ interactions by the coverage of the period we are considering, or we can calculate the individual Reach ERs of each post and then calculate the average of all posts’ ER in that time period.
To recap, you have just seen an overview of the KPIs that will help you understand whether your Instagram strategy is going in the right direction or whether something needs to be changed. Of course, you can track as many indicators as you think will help you best interpret the performance of your business, or you can decide to rely on external platforms specializing in analyzing results that will provide you with even more data, for a more complete analysis that is better suited for your needs.
Curious to find out more news about the world of social media and digital marketing and always want to be “on the ball”? Sign up to our newsletter to be updated on all the latest news 📫


Leave a Reply