

Social media numbers are often underestimated: as they are so big, they may look like mere and unuseful statistics. However, reading them in context is of great help when planning a strategy, organic or paid, more focused on our goals.
[Article published on 27/10/2020 and uploaded on 21/06/2024 with new information, editor’s note.]
In this article we will tackle the following subjects:
- numbers on a global scale
- most used platforms
- gender and geography
- users’ usage
- advertising spend
[The following data is updated as of June 21st 2024]
Numbers on a Global Scale
More than 60% of the world population uses social media. That means 5 billion users.
It is the first time, since social networks were invented, that such impressive numbers are achieved. This data, as showed by Meltwater (source: https://www.meltwater.com/en/about/press-releases/report-global-social-media-users-pass-5-billion), sounds per se extraordinary if we think that twenty years ago social networks did not exist at all.
And it sounds even more unbelievable when we think that their growth does not seem to stop: compared to 2023, social media users registered an increase of 5,6%, i.e. 266 million new users, with 8,4 new users every second (of people who are over 13 years old, minimum age for creating a social media account).
To get an idea of what this number means, just realize that every 24 hours an average of 237.000 human beings are born: 81 million “new” human beings per year, and fourfold new social media users.
The preferred device to use social media is still the mobile, chosen by 99% of users, although during last spring’s lockdown, many users also incremented the engagement through other devices, such as laptops (47%), desktop computers (33%), smart tv (32%) and tablet (23%).
The average amount of time spent on social networks is also growing up to 2 hours and 23 minutes per day, and uses 6,7 per month.
Most Used Platforms
As far as platforms are concerned, let us take into consideration a couple of interesting aspects.
The first one is noticing that there is an overlap of users on different platforms: in 2020 each internet connected user, in fact, has an average of 8,8 accounts on social networks.
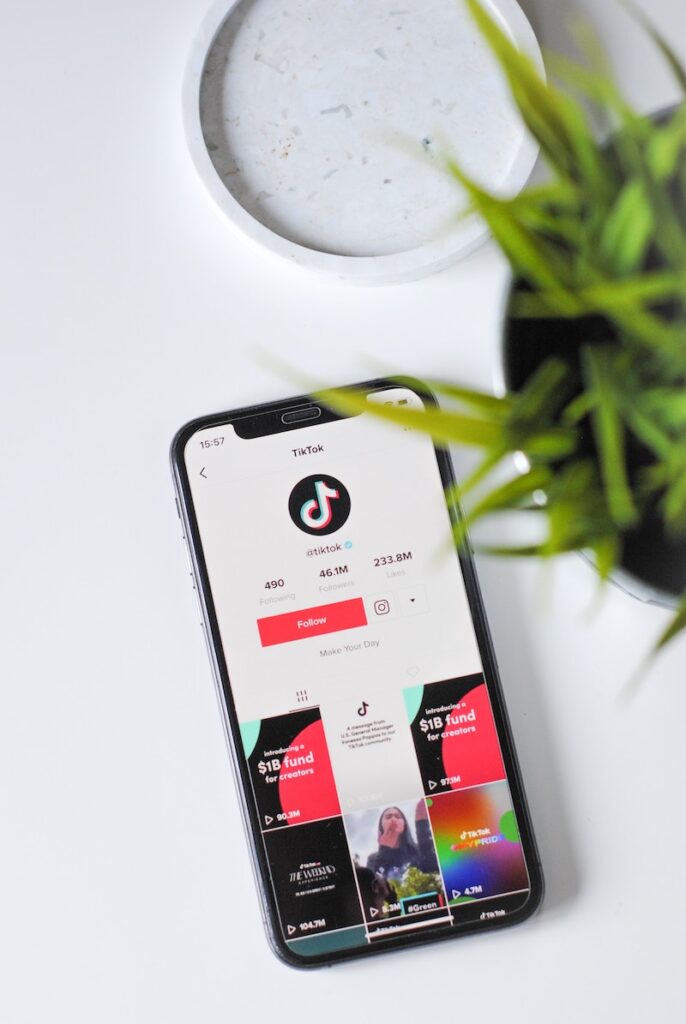
The second relevant aspect is that the group of platforms owned by Facebook is still on top of the list, regardless of the precipitous growth of new platforms, such as TikTok, which we saw increase by 58.20% from 2022 to 2024 with an average of more than 1 billion monthly active users. (source: https://greenmarketing.agency/social-network-piu-usati-al-mondo)
With more than 3 billion active users on a monthly basis, Facebook is still the most used social network, while in second place we find YouTube with about 2 and half billion users.
With such fact in mind, it is not surprising for Facebook to have decided to implement the video content platform Facebook Watch, and it is even less surprising for it to push this type of content when it comes to advertising, promising greater opportunity of engagement and visibility.
Instagram is growing too, with more than 2 billion users, still behind WhatsApp (owned by Facebook), with 2 billion users, which seems to be the users’ favourite among instant messaging platforms, along with Facebook Messenger (1 billion) and WeChat (1,3 billion).
Gender and Geography
From a social media marketing perspective, this translates into a greatly vast audience, which seems to be able to expand infinitely.
Infinitely, at least, as far as numbers are concerned, since as to geography, gender and age, there still are differences: only 1 in 11 people in East and Central Africa use social media.
The same happens with gender which, in 2024, sees a majority of male users over female’s (53,5% vs 46,5%). In all age groups, then, more women are on social media, with a near balance among users aged 35 to 44. (source: https://www.ansa.it/canale_tecnologia/notizie/web_social/2023/07/21/nel-mondo-piu-del-60-delle-persone-sono-sui-social-media_d0303998-ae8e-49d0-ae4f-8bd407a8bc6b.html)
Users’ Utilization
Social networks still prove to be one of the favorite hobbies for internet users, with an average spent time of 2 hours and 23 minutes per day. Furthermore, time dedicated to social networks utilization greatly incremented, by 43%, during Coronavirus pandemic.
But how is time spent on social media? The main purpose for using them is still socializing, interacting with family and friends.
Other reasons, however, are gaining importance, such as news search: the number of people claiming to use social media to get information doubles the number of users preferring traditional media, such as newspapers. 27% of US users between 18 and 24 years old state to search news on social media, rather than other traditional sources.
From 2023 to the present, Twitter (now called X) had a 40% growth to an average of 611 million monthly active users.
This has probably much to do with the informative nature of Twitter: during last spring’s lockdown, Covid-19 related tweets were posted in a number between 13 and 20 million per day (source: https://influencermarketinghub.com/coronavirus-marketing-ad-spend-report/).

This kind of data brings obviously up the topics of fake news and related conspiracy theories: in the second quarter of 2020, Facebook (used by 46% of users to search information) removed 7 million posts for disseminating false information about Coronavirus, such as fake preventative measures or scientifically non-reliable cures.
The same thing happened with posts containing hate speech: 22 and a half million posts were removed from the platform in the same period (source: shorturl.at/agizD).
Moreover, for many users, social media are even taking the place of search engines: as an example, in Myanmar (formerly known as Burma), such a use is so common that, when buying a new smartphone, Facebook is often pre-installed instead of Google Chrome. And, sometimes, a personal account is even created directly by the sale staff, before giving the new phone to the buyer (source: The Social Dilemma, Netflix).
After socializing, another reason for choosing social media is entertainment: finding amusing and engaging content, to fill up spare time, seems to be of primary importance for users.
This brings us back to the role played by a well-planned organic strategy: if thanks to paid advertising we can sponsor our products, attract new potential users and push them to purchase, it is thanks to organic posting that we can create valuable, useful and entertaining content and, as a consequence, build customer loyalty to the brand.
In 2019, 41% of users, in fact, state to turn to social networks to get more information about brands, products or services, and more than 7 out of 10 buyers are influenced by social media, second only to search engines, when deciding to purchase products or services (source: https://awario.com/blog/how-social-networks-influence-74-of-shoppers-for-their-purchasing-decisions-today/).
But if we look closer, we shall see that things are changing in favor of social media: over half of female users between the age of 16 and 24 claim to prefer social networks to search for products and services, vs only 46% claiming to use more often search engines (source: https://blog.hootsuite.com/simon-kemp-social-media/).

Advertising Spend
It is now clear why investing in social media advertising could bring great benefits: if users turn to such platforms to search information about products, brands and services, they should be able to find as much as possible, so that this can translate into a real purchase action.
In 2021, we saw a major brake in social media advertising investment certainly due to the unfavorable economic situation caused by the pandemic. Although, as we have seen, the lockdown months have seen an increase in social usage by users, things are different for businesses.
Those who continued to invest during those years saw both costs per click and costs per impression drop significantly, leading to unusually high generated revenue (recall that an auction system is used to determine these costs).
However, according to research by Influencer Marketing Hub, not only did 74% of businesses say they posted less content on their accounts, but 34% say they completely canceled at least one social advertising campaign (in the planning stage); 45% stopped at least one campaign that was already active, while 38% put new advertising investments on standby until the end of the year.
Finally, overall, 89% of respondents admit that they have acted on the budget dedicated to advertising (source: https://influencermarketinghub.com/coronavirus-marketing-ad-spend-report)
In recent years, however, we see the data growing: in 2023, social advertising spending saw an increase of 11.1% to 96.9 billion, the same may not happen in 2024 (source: https://iab.it/adex-benchmark-2023-i-dati-delladvertising-europeo)
Therefore, spending could also grow more substantially in 2024, the year for which the increase is projected to be +7.2 percent (source: https://www.mark-up.it/pubblicita-il-punto-sul-2023-e-le-previsioni-di-spesa-per-il-2024/).